A couple of weeks ago I wrote up AI budgets and hard spend limits in Enterprise
agentgateway
— a day-one, YAML-and-curl field report on the new EnterpriseAgentgatewayBudget
CRD. That post answered how do I declare a budget and watch it trip?
This one answers the question the platform lead actually asks at standup: which
teams are on track, and who’s blown their allocation? Because the same budgets
you declare in YAML now surface as a first-class view in the solo enterprise for
agentgateway console — under Cost Management → Budgets — where spend is
something you read, not something you kubectl get and squint at.
This is a tour of that experience. Everything below is a live lab: a management cluster running solo enterprise for agentgateway, three teams (platform, sales, marketing) with per-user and per-team token budgets, and enough traffic driven through the gateway to push one of them over the edge on purpose.
The Budgets tab at a glance
Cost Management is where the gateway’s per-request cost telemetry rolls up. The Budgets tab lists every budget selected by an active gateway budget-enforcement policy, with a one-line health readout for each.
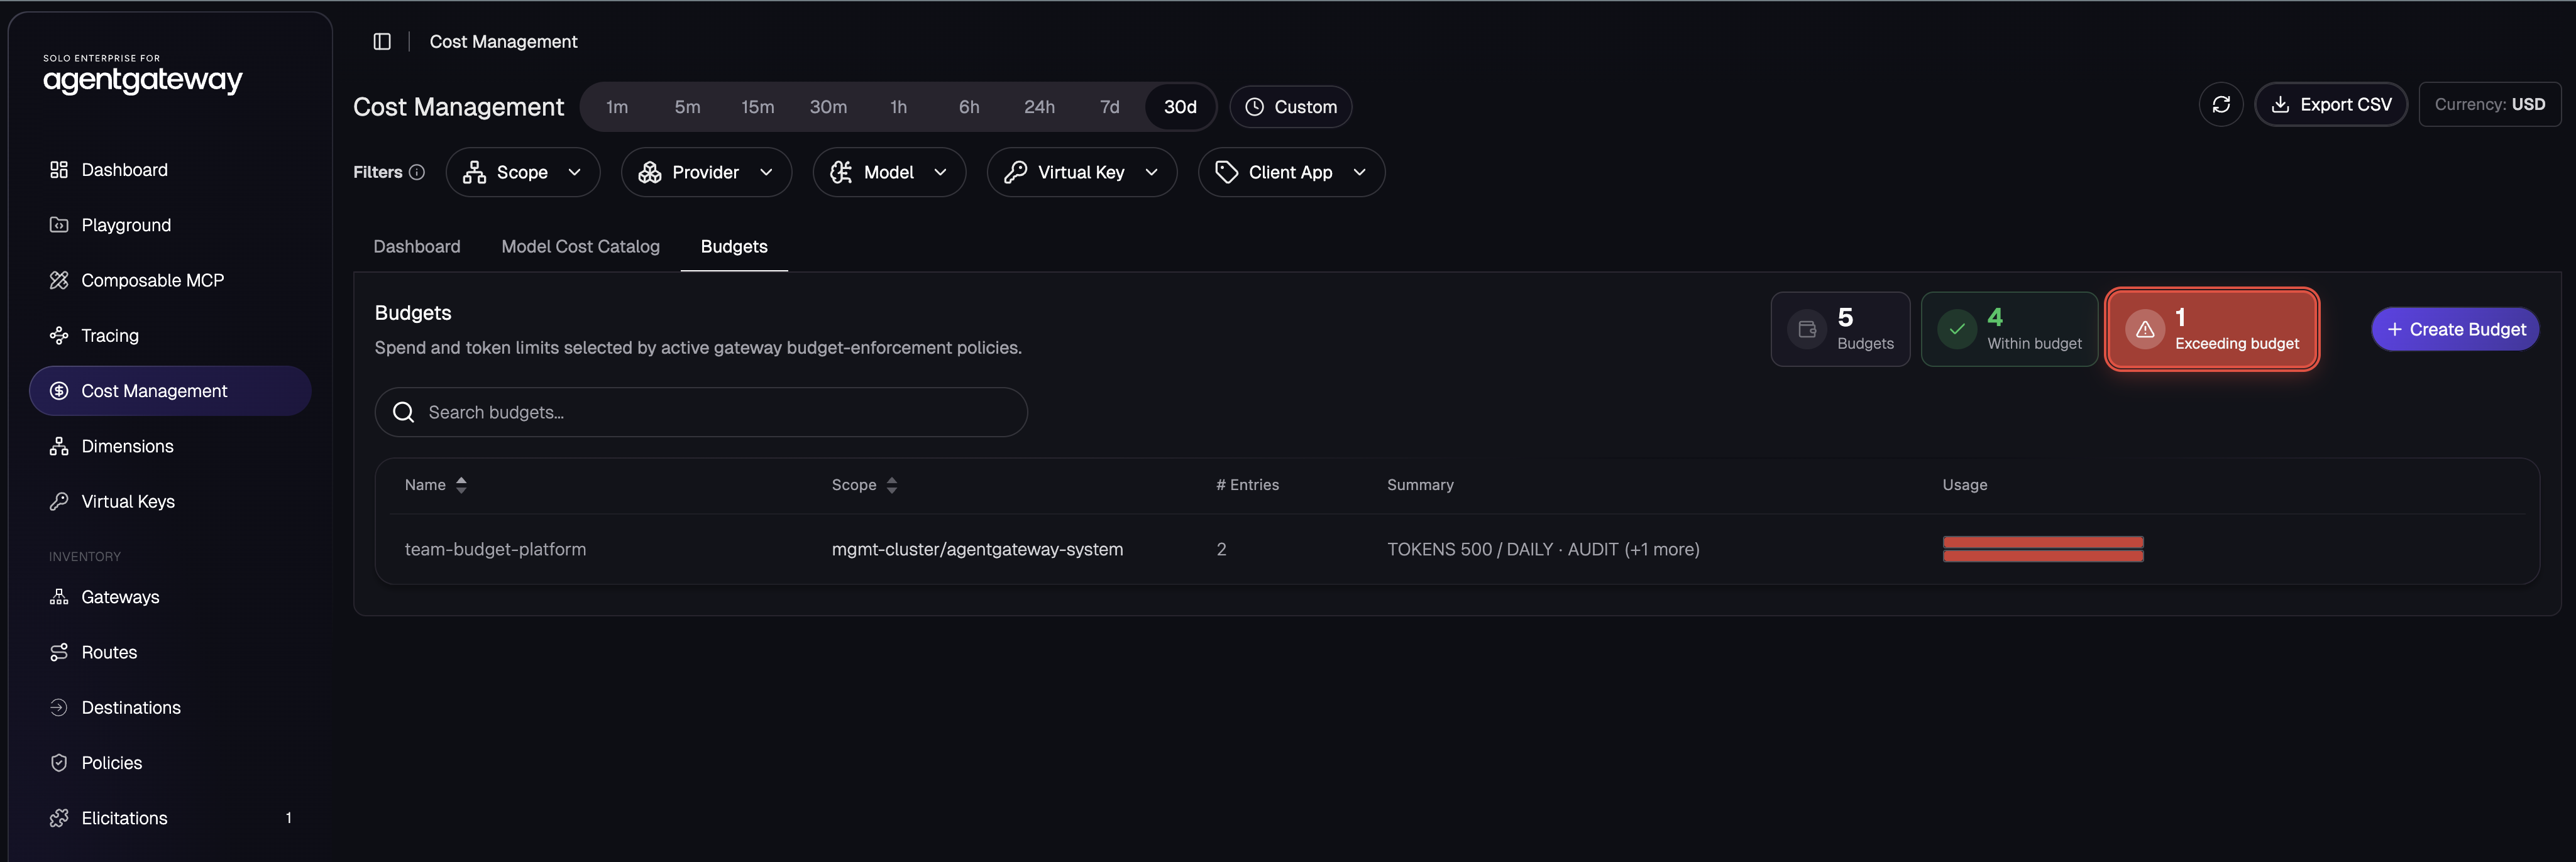
Three things are worth reading here:
- The summary chips —
5 Budgets,4 Within budget,1 Exceeding budget. This is the whole point of the view: a single glance tells you the fleet is mostly healthy and exactly one budget needs attention. Click the red Exceeding budget chip and the list filters to just the offender. - The Summary column —
TOKENS 500 / DAILY · AUDIT (+1 more). Each budget is denominated in tokens or USD, accrues over a rolling window (here, Daily), and carries an enforcement action — Audit or Block. The(+1 more)tells you the budget has multiple entries with their own limits. - The Usage bars — green when under, red when over.
team-budget-platformis the one showing red; everyone else is comfortably in the green.
The scope column (mgmt-cluster/agentgateway-system) tells you where each budget
lives — cluster and namespace — which matters once teams start keeping their own
Budget objects in their own namespaces.
Anatomy of a budget
Before drilling in, the mental model. A budget is a named container scoped to a target (a gateway or route), holding one or more entries. Each entry is an independent limit with four dimensions:
| Field | What it means | In the screenshots |
|---|---|---|
| Subject | Which requests the entry applies to — a user, a group, or unscoped | user alice, group platform |
| Limit | The cap, in tokens or USD | 200 tokens, 500 tokens |
| Rolling window | The trailing period spend ages out of | Daily (24 hours) |
| When exceeded | Audit (observe) or Block (429) | Audit |
The budget’s Total Usage is the roll-up across its entries. That lets you do something genuinely useful: put a per-team ceiling and a per-user ceiling in the same budget, and watch both at once. A single heavy user can be over their personal allocation while the team as a whole is still fine — and the UI shows you both facts side by side.
Drilling in: team-budget-platform
This is the budget flying the red flag. Open it and the story is immediate:
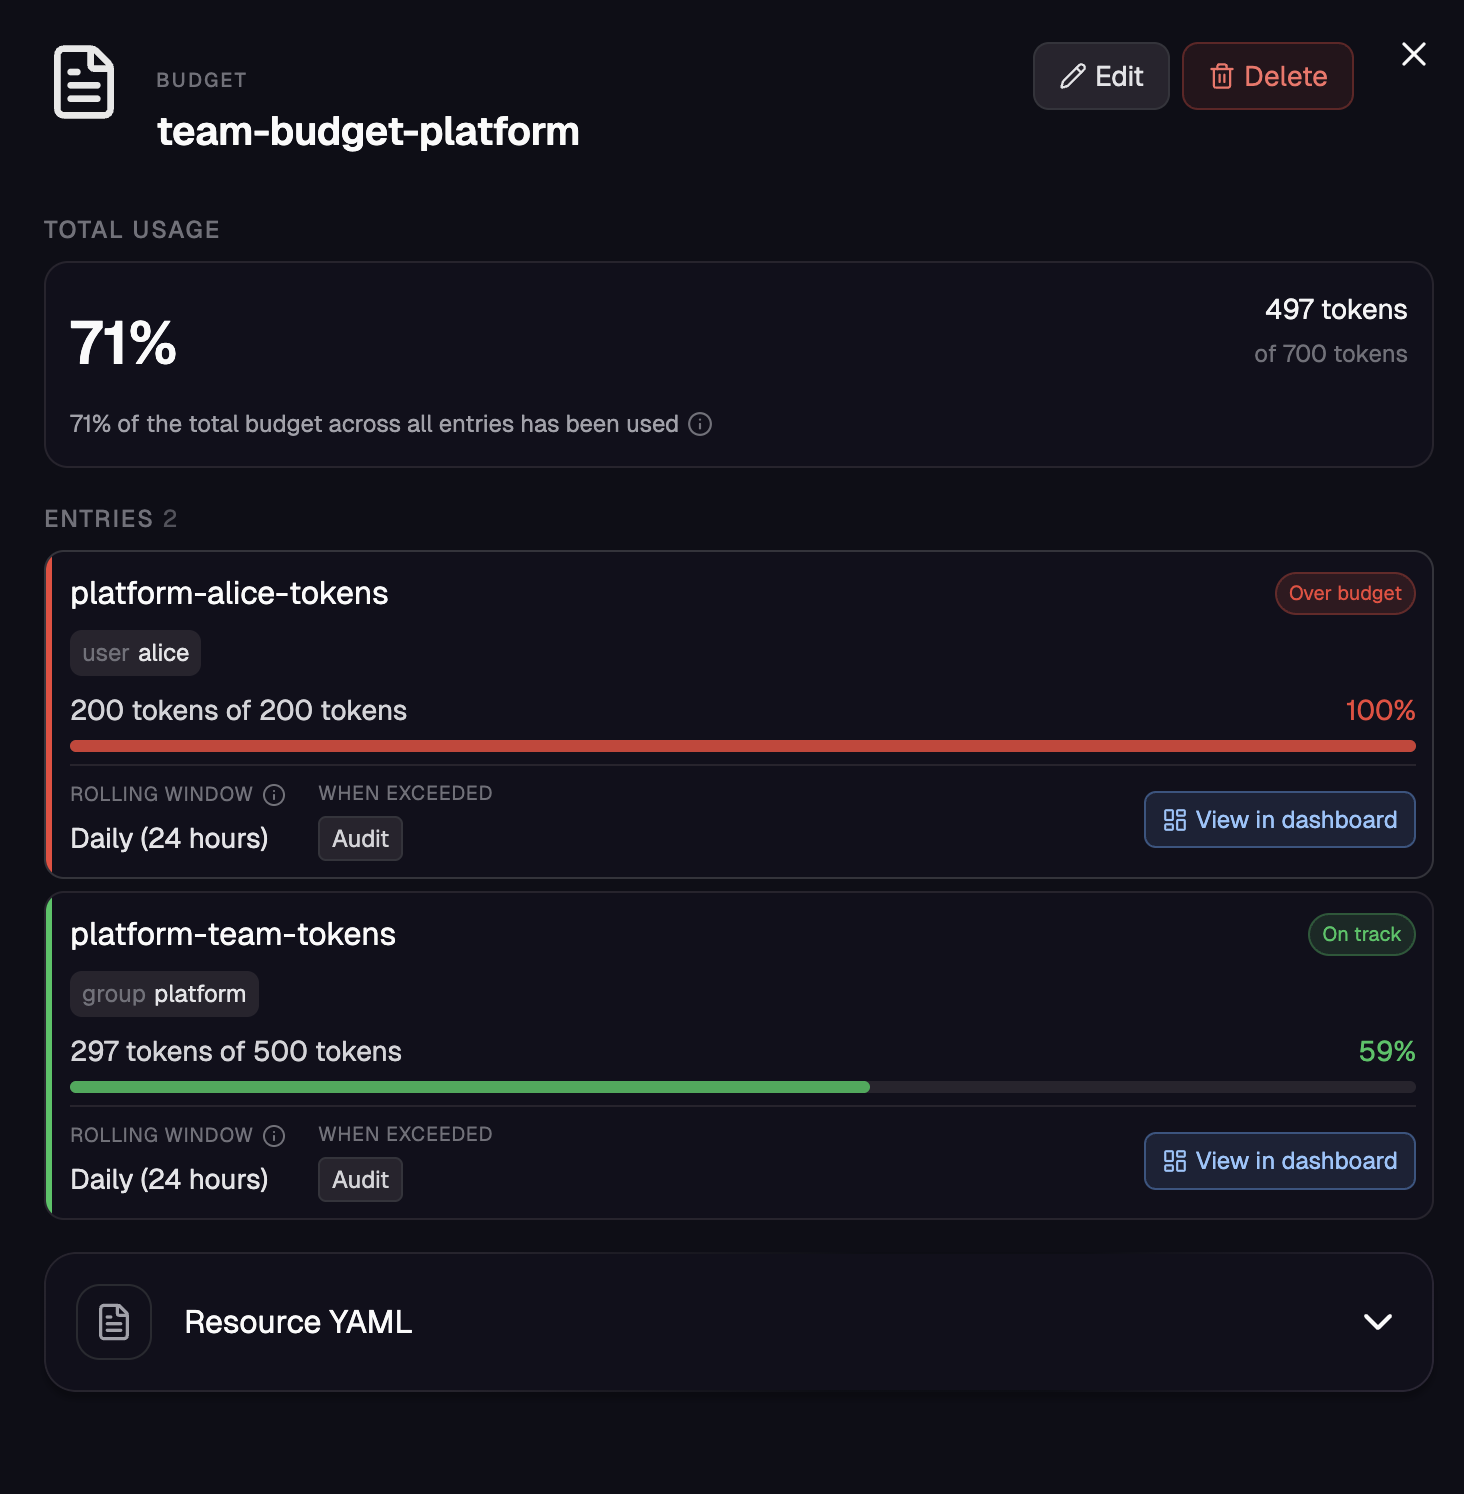
Two entries, two very different stories:
platform-alice-tokens— scoped touser alice, capped at 200 tokens/day. She’s at 200 of 200 — 100%, Over budget, the bar solid red. Alice has been the heavy user today.platform-team-tokens— scoped togroup platform, capped at 500 tokens/day. The team is at 297 of 500 — 59%, On track, comfortably green.
The Total Usage rolls both into 71% — 497 of 700 tokens. That’s the
per-user + per-team pattern doing exactly what it should: alice individually
tripped her limit, but the platform team still has room. One noisy user hasn’t
consumed the whole team’s allocation, and you can see precisely where the pressure
is without cross-referencing anything.
Because both entries are set to Audit, nothing is blocked — alice’s requests
still succeed. Audit mode is visibility first: the gateway records the overage,
paints it red, and lets traffic through so you can decide whether that limit is
right before you ever arm enforcement. (Flip onBudgetExceeded to Block and
that same 100% entry starts returning 429s instead.)
Each entry also has a View in dashboard link that pivots straight into the filtered Cost Management dashboard for that subject — from “who’s over” to “what exactly did they run” in one click.
What healthy looks like: team-budget-sales
For contrast, the sales budget is the picture of a team well within its means:
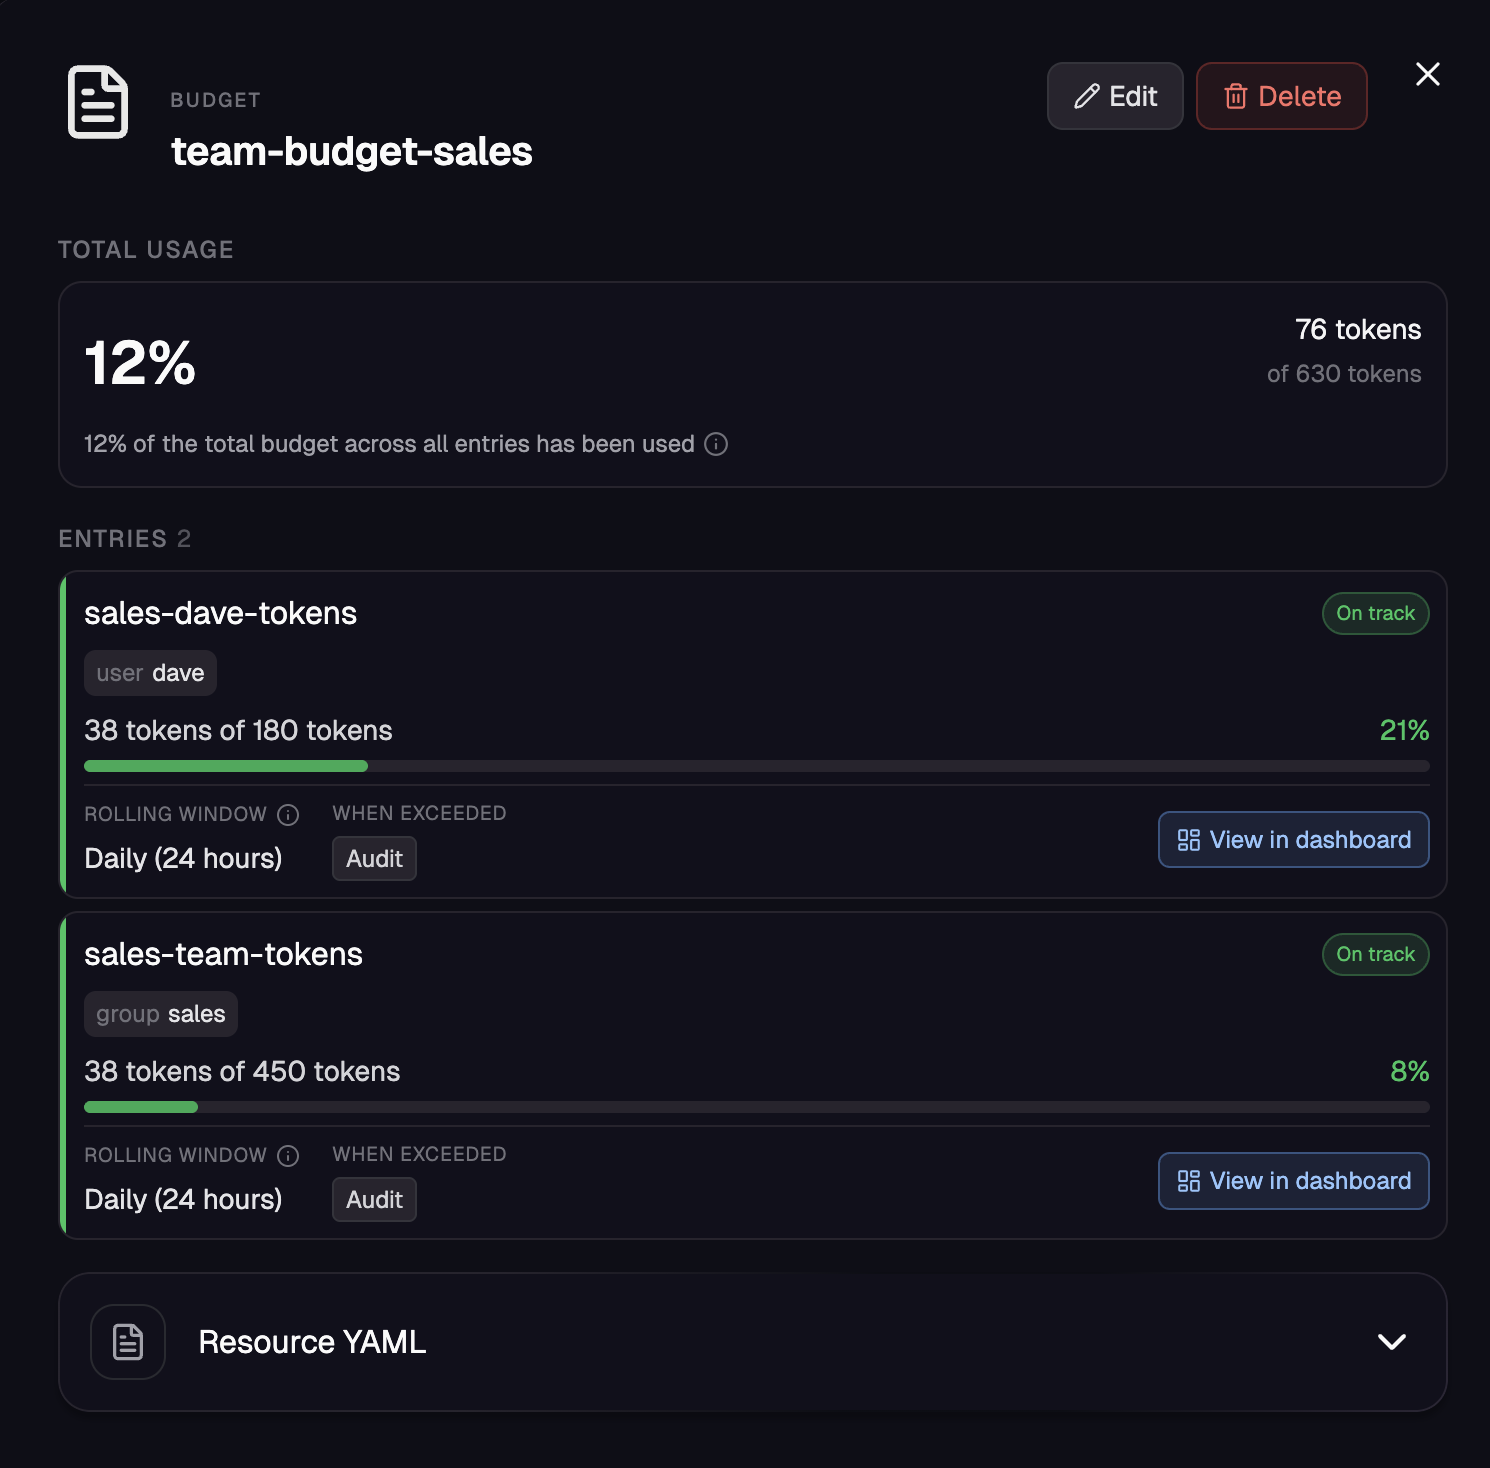
Same shape — a per-user entry (sales-dave-tokens, user dave, 180 tokens) and
a per-team entry (sales-team-tokens, group sales, 450 tokens) — but every bar
is green. Total usage sits at 12% — 76 of 630 tokens. Dave’s at 21% of his
personal cap, the team at 8% of theirs. Nothing to see, which is precisely the
signal you want most of your teams to be sending.
Line the two budgets up and the console is doing real FinOps work: same gateway, same route, different wallets — platform under pressure, sales idle — each with its own per-user and per-team accounting, all readable in seconds.
The status vocabulary
Two layers of status, and it’s worth being precise about them:
- Per entry: On track (green) or Over budget (red). This is about a single limit — one user, one group.
- Per fleet: the summary chips count budgets as Within budget or
Exceeding budget. A budget is “exceeding” the moment any of its entries
is over. That’s why one over-limit alice entry tips the whole
team-budget-platformbudget — and the fleet counter — into the red.
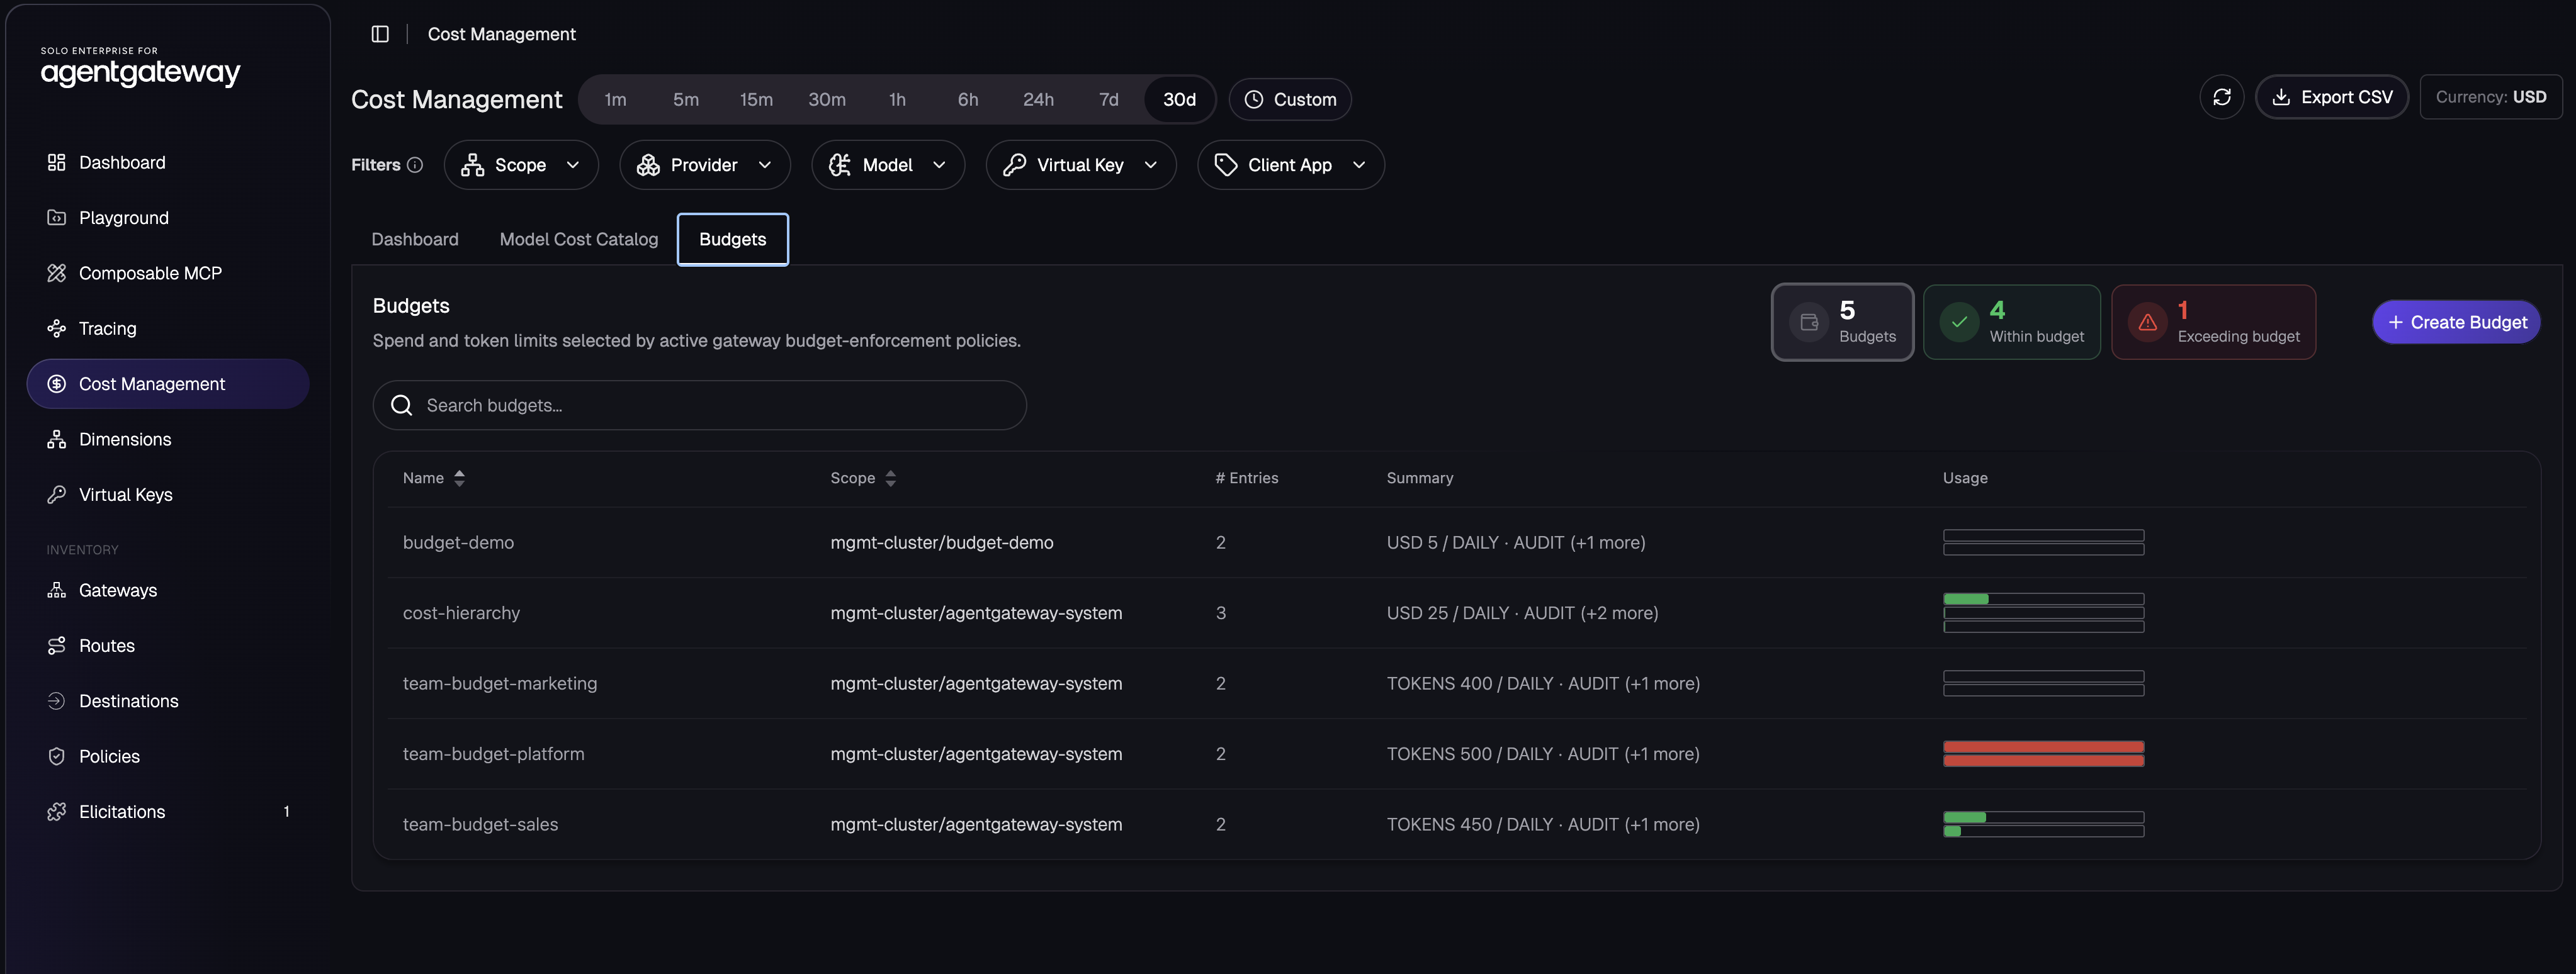
And crucially, status is independent of enforcement. Everything in this lab runs in Audit — so “Over budget” and “Exceeding budget” here mean recorded and flagged, not blocked. That separation is the feature: you get the full red-flag dashboard experience long before you ever cut anyone off, which is exactly how you should roll budgets out.
The YAML behind the view
The console is a lens, not a second source of truth. Every budget carries a
Resource YAML panel showing the EnterpriseAgentgatewayBudget object it
renders. For team-budget-platform, that object is roughly:
apiVersion: enterpriseagentgateway.solo.io/v1alpha1
kind: EnterpriseAgentgatewayBudget
metadata:
  name: team-budget-platform
  namespace: agentgateway-system
spec:
  budgets:
    - name: platform-alice-tokens
      subject:
        user: alice          # per-user entry
      limit:
        unit: Tokens
        amount: 200
      window:
        unit: Day
      onBudgetExceeded: Audit
    - name: platform-team-tokens
      subject:
        group: platform      # per-team entry
      limit:
        unit: Tokens
        amount: 500
      window:
        unit: Day
      onBudgetExceeded: Audit
The subject block is what makes the two entries different: one keys on the
user dimension, the other on group. Everything you saw in the drill-in —
the two bars, the two limits, the rolled-up total — is just this object,
rendered. Create a budget in the UI and you get this YAML; commit this YAML via
GitOps and you get the UI. Same object, two doors.
How it works under the hood
A few mechanics tie the pretty bars to reality — covered in depth in the hands-on post, so here’s the short version:
- Dimensions come from request identity.
userandgroupvalues are resolved per request from trusted identity — headers derived from JWT claims or API-key metadata — so the gateway knows whose wallet to charge before it ever forwards the call. An entry’s subject matches when every key/value it lists matches the request’s resolved dimensions ("*"matches any non-missing value; omitsubjectand the entry applies to every request on the target). - Windows are rolling, not calendar. A
Dailybudget looks at the trailing 24 hours. Spend ages out continuously — a tripped budget recovers as old requests fall off the window, rather than snapping back to zero at midnight. - USD budgets need a cost catalog. Token budgets count
total_tokens(input + output). Dollar budgets multiply realized per-request cost — computed from the model cost catalog — so the console can show youUSD 5 / DAILYjust as easily asTOKENS 500 / DAILY(both appear in the budget list above). - Audit and Block are the two gears. Audit records and flags; Block returns
429with the rolling window in the reset header. The whole rollout path is: ship budgets in Audit, watch the console for a week, then arm Block only where runaway spend would actually hurt.
Wrapping up
The CRD gave platform teams a way to declare LLM spending limits. The Cost
Management UI gives them a way to govern against those limits day to day —
per-team and per-user ceilings, rolling windows, and a red-means-attention
readout that a finance partner can look at without touching kubectl.
The scenario in these screenshots — platform straining while alice sits over her
personal cap, sales cruising at 12% — took nothing more than a handful of token
budgets with user and group subjects and some traffic to push through them.
Every budget still lives as YAML you can GitOps; the console just makes the
answer to “who’s over?” a one-glance question instead of a query.
Audit first, watch the bars, then arm Block where it counts.