agentgateway Standalone: A Cost & Tokenomics Dashboard in One Command
Introduction
You’re routing LLM traffic through a gateway. But do you actually know what it costs? Not the rough monthly invoice from your provider — the real breakdown. Which model burned the most tokens last night? Which user is driving 80% of your spend? Which provider is quietly eating your budget?
agentgateway answers those questions out of the box. Every request that flows through the proxy is priced against a per-model rate catalog and surfaced in a built-in Costs and Analytics dashboard. No external observability stack, no Prometheus, no Grafana — just the standalone binary.
This guide gets you from zero to a fully populated tokenomics dashboard in a single command. We’ll use a Docker-based demo that seeds 5,000 simulated requests across 7 days, so the dashboard has something interesting to show you the moment it boots — then we’ll send real traffic through it and watch it get priced live.
Why This Matters
Cost visibility is the FinOps story for AI. As soon as more than one team, agent, or app starts calling LLMs through shared infrastructure, “what did this cost and who spent it?” becomes a board-level question. agentgateway answers it at the gateway layer, which means:
- Per-model pricing — every request is priced against a rate catalog (input, output, and cache token rates), so dollars show up next to tokens automatically.
- Group by anything — slice spend and tokens by model, provider, user, group, or user agent (Cursor, Claude Code, openai-python, etc.).
- Zero application changes — your apps just point at the gateway. The accounting happens in the proxy, not in your code.
- One binary — the dashboard ships inside agentgateway. There’s no separate metrics pipeline to stand up for basic cost visibility.
What You’ll Build
                                       ┌──────────────────────────────┐
  ┌──────────────┐                     │        agentgateway          │
  │ Your apps /  │   /v1/chat/         │  ┌────────────────────────┐  │      ┌────────────┐
  │ agents /curl │───completions──────▶│  │ LLM proxy  (port 4000) │──┼─────▶│   OpenAI   │
  └──────────────┘                     │  └───────────┬────────────┘  │      └────────────┘
                                       │              │ priced per     │
                                       │              │ model catalog  │
                                       │  ┌───────────▼────────────┐  │
  ┌──────────────┐   localhost:15000   │  │  Admin UI + Dashboard  │  │
  │  Your browser│────────────────────▶│  │  Costs / Analytics     │  │
  └──────────────┘                     │  └───────────┬────────────┘  │
                                       │              │               │
                                       │      ┌───────▼───────┐       │
                                       │      │ SQLite data.db │       │
                                       │      │  request_logs  │       │
                                       │      └───────────────┘       │
                                       └──────────────────────────────┘
agentgateway proxies LLM traffic on port 4000 and serves its admin UI and dashboards on port 15000. Every request is written to a SQLite database (data.db) and priced using a model catalog (base-costs.json). The mock generator writes to the same request_logs schema, which is why the dashboard is populated before you send a single real request.
Prerequisites
- Docker installed and running
curl- An OpenAI API key
- Python 3.11+ (or
uv) — used by the mock-data generator
Quick Start: One Command
Clone the demo and run the setup script:
git clone https://github.com/sebbycorp/agentgateway-demos.git
cd agentgateway-demos/00-standalone-latest

export OPENAI_API_KEY='sk-...'
./setup.sh
That’s it. Open http://localhost:15000/ui/ and head to the Costs and Analytics sections — they’re already full of data.
What the script does
setup.sh is a single-command bootstrap. Under the hood it:
- Runs preflight checks — verifies Docker is installed and the daemon is running,
curlis available,OPENAI_API_KEYis set, and thatuvor Python 3.11+ is present. - Downloads the mock-data generator (
gen-mock-logs.py). - Generates a SQLite database with simulated fleet traffic:
gen-mock-logs.py --replace --requests 5000 --days 7 -o data/data.db - Writes
config.yamlpointing the gateway at the database and the model rate catalog. - Pulls the agentgateway image (
cr.agentgateway.dev/agentgateway:v1.3.1) and removes any previous demo container. - Seeds a named Docker volume (
agw-cost-demo-data) with the generated database. - Launches the container, binding ports to loopback only:
127.0.0.1:4000:4000     # LLM proxy
127.0.0.1:15000:15000   # admin UI + dashboards
Why loopback only? The proxy port carries your API credentials. Binding to
127.0.0.1keeps the demo off your network. Don’t expose these ports without locking down auth and CORS first.
Tuning the dataset
Want a bigger or smaller demo dataset? Override the REQUESTS and DAYS environment variables before running setup:
REQUESTS=20000 DAYS=30 ./setup.sh
Exploring the Dashboard
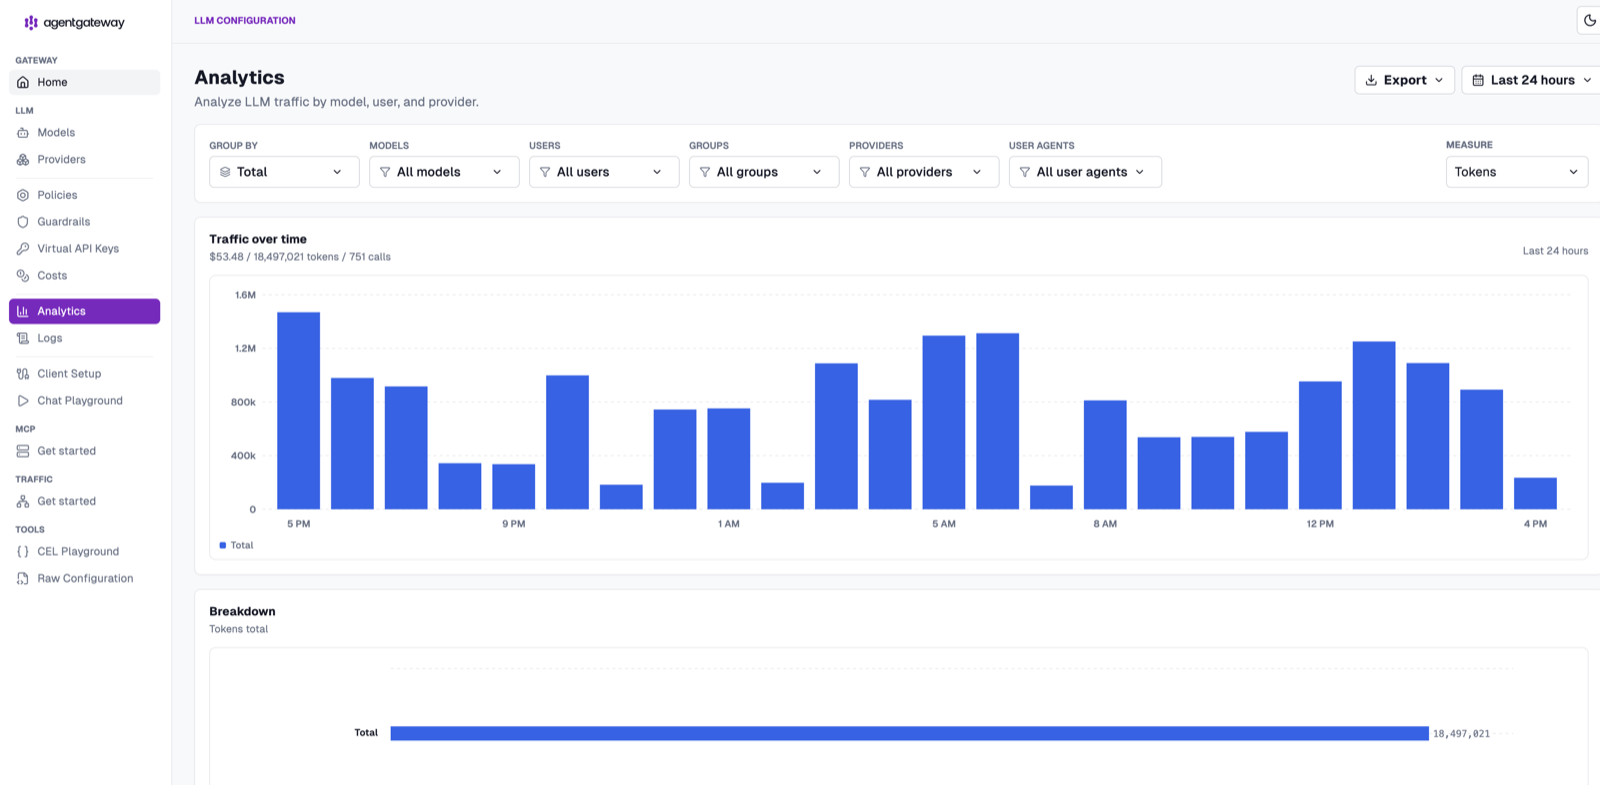
Open http://localhost:15000/ui/ and click Analytics. By default it shows total traffic over the last 24 hours — token volume per hour with a running tally of cost, tokens, and calls.
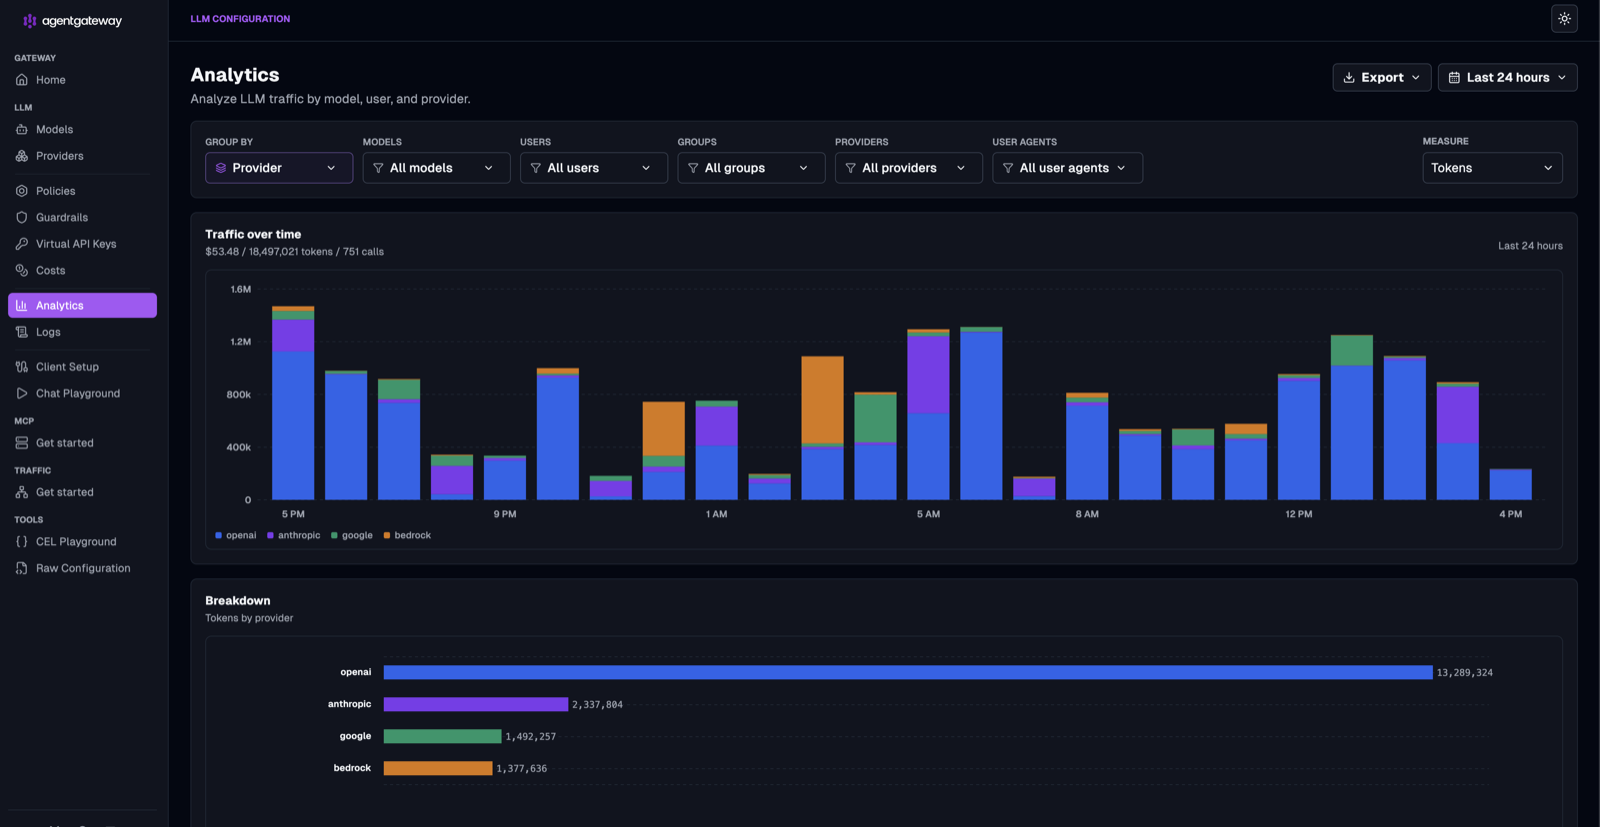
The real power is in Group by. Switch it to Provider and the same traffic splits out by backend — here OpenAI dominates with ~13.3M tokens, followed by Anthropic, Google, and Bedrock. The breakdown table underneath ranks every provider by token consumption.
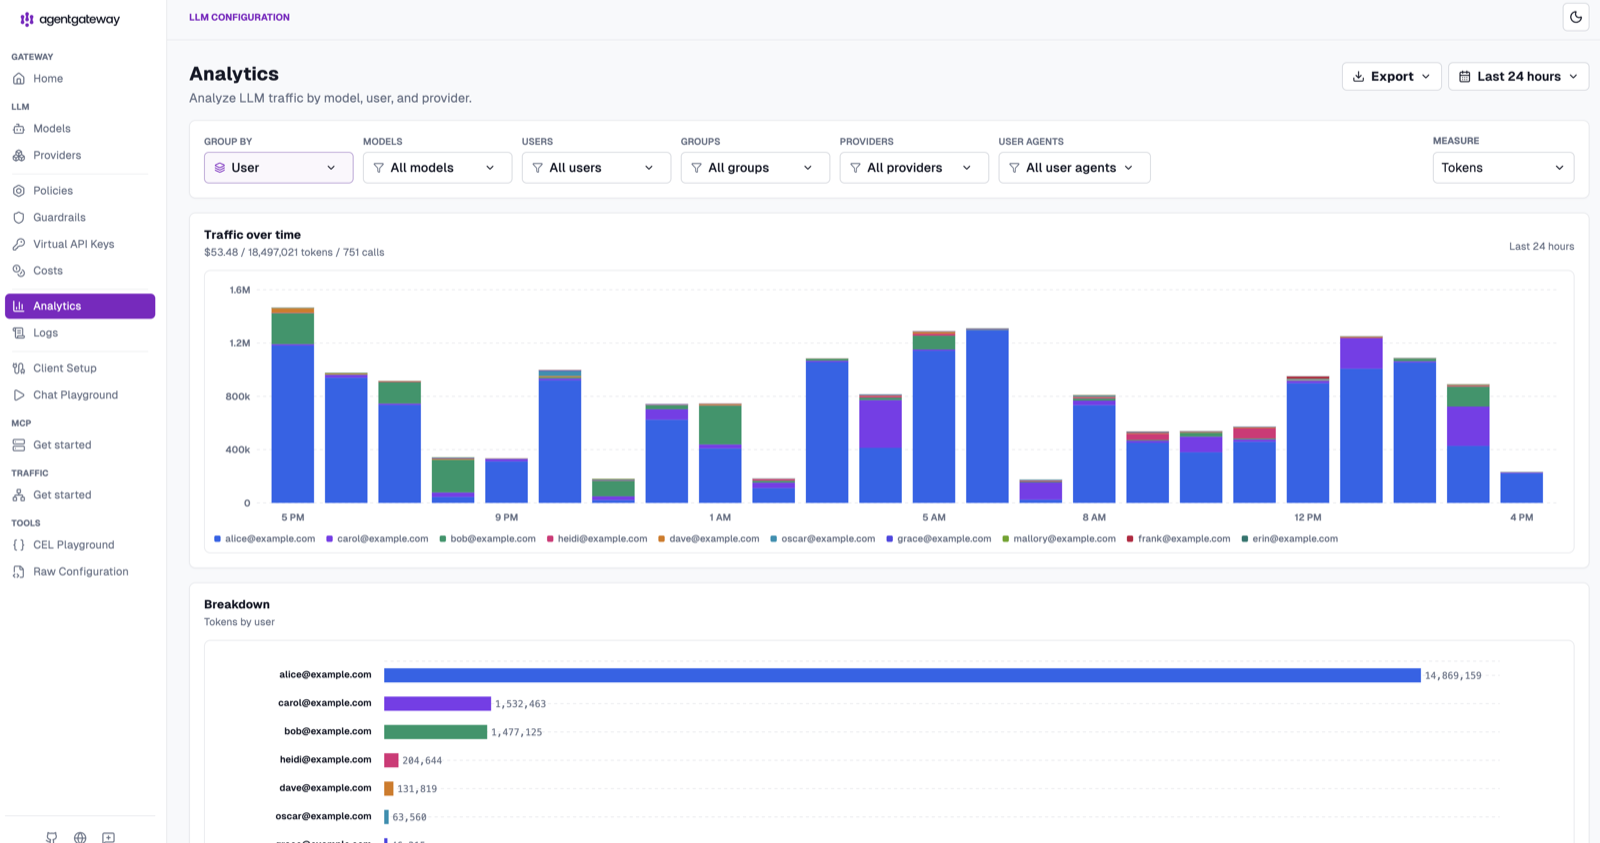
Switch Group by to User and you get per-person accounting — exactly the view you need when you’re trying to figure out who’s driving spend. Each bar in the time series is stacked by user, and the breakdown ranks them by tokens consumed.
You can group by Model, Provider, User, Group, or User agent (Cursor, Claude Code, openai-python, codex, bifrost, and more), and switch the Measure between tokens and cost. The Costs page focuses the same data on dollars, and Export lets you pull the underlying numbers out for reporting.
How It Works: The Generated Config
The setup script writes a config.yaml that wires everything together. Here are the pieces that matter:
config:
  adminAddr: "0.0.0.0:15000"        # admin UI + dashboards (reachable from host)
  database:
    url: "sqlite:///data/data.db"   # /data is the mounted ./data dir in the container
  modelCatalog:
    - file: /base-costs.json        # per-model rates so every request is priced

llm:
  port: 4000
  policies:
    cors:                           # demo-only: wildcard CORS. Safe because the port
      allowOrigins: ["*"]           # is loopback-bound. Restrict this for real use.
      allowHeaders: ["*"]
      allowMethods: ["GET", "POST", "OPTIONS"]
  models:
    - name: "openai/gpt-4.1"
      provider: openAI
      params:
        model: gpt-4.1
        apiKey: "$OPENAI_API_KEY"
    - name: "openai/*"              # fallback: cheaper nano model
      provider: openAI
      params:
        model: gpt-4.1-nano
        apiKey: "$OPENAI_API_KEY"
Three things make the dashboard work:
database.url— the admin UI’s Costs/Analytics pages read from this SQLite database. The mock generator writes the samerequest_logsschema, so generated traffic and real traffic land in one place.modelCatalog—base-costs.jsonholds per-model input/output (and cache) token rates. This is what turns raw token counts into dollars.models— two routes: an explicitopenai/gpt-4.1and a wildcardopenai/*that falls back to the cheapergpt-4.1-nano.
Send Real Traffic
The mock data gets you a populated dashboard, but the gateway is live — send it a real request and watch it get priced alongside the simulated traffic:
curl -X POST http://localhost:4000/v1/chat/completions \
  -H "Content-Type: application/json" \
  -d '{
    "model": "openai/gpt-4.1",
    "messages": [{"role": "user", "content": "Hello from agentgateway!"}]
  }'
Refresh the Analytics page and your request shows up — tokens counted, cost calculated against the model catalog, attributed to the model and provider. Every real call from here on is accounted for the same way.
Manual Installation
Prefer to run the binary directly instead of the Docker demo? You have three options:
# 1. Automated installer
curl -sL https://agentgateway.dev/install | bash

# 2. Download a platform-specific binary from the GitHub releases page
#    https://github.com/agentgateway/agentgateway/releases

# 3. Run via Docker with your own config mounted
docker run --rm \
  -p 127.0.0.1:4000:4000 \
  -p 127.0.0.1:15000:15000 \
  -v "$(pwd)/config.yaml:/config.yaml" \
  cr.agentgateway.dev/agentgateway:v1.3.1 --file /config.yaml
Point it at a config.yaml like the one above, and the proxy listens on port 4000 with the admin UI on 15000. From there it’s the same dashboard — minus the pre-seeded mock data.
Cleanup
When you’re done, tear the demo down with the included script:
./destroy.sh
This stops and removes the container and the named volume.
Wrapping Up
Cost and token visibility is one of those things you don’t realize you’re missing until a bill lands. agentgateway puts it right in the box: per-model pricing, a built-in dashboard, and grouping by model, provider, and user — no external observability stack required. The Docker demo gets you a populated dashboard in one command so you can see exactly what it looks like before pointing real traffic at it.